I crafted high-functionality, end-to-end analytics dashboards and digital experiences for Citi.
PBWM Technology | Employee Experience Design / Data Transformation
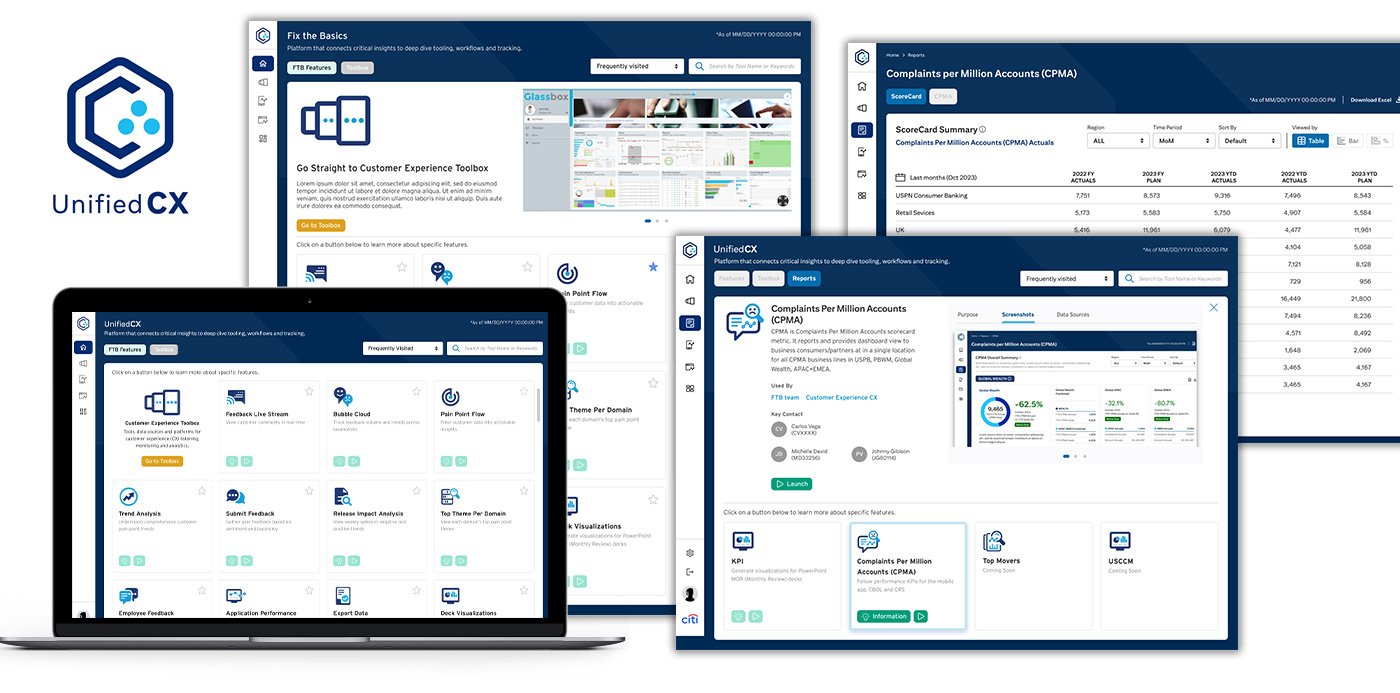
UnifiedCX, All-in-One Platform for CX Listening Tools
Phase 1. UCX Platform, FTB migration, enhancement
Research, UX/UI strategy, prototypes
Phase 2. UnifiedCX Toolbox design, and guided experience
Research, UX/UI strategy, prototypes
Phase 3. CPMA (Complaints per Million Accounts) and TopMovers.
Research, UX/UI strategy, prototypes
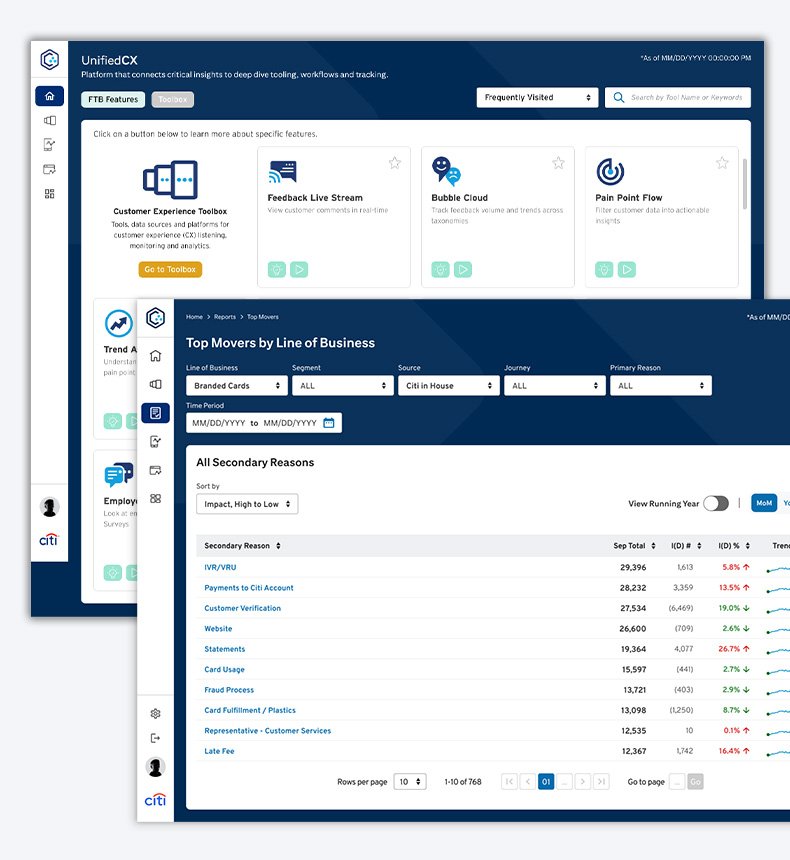
UnifiedCX Platform: Modernizing Fix the Basics with Enhanced Functionality
Logo Identity and Application Icon Design
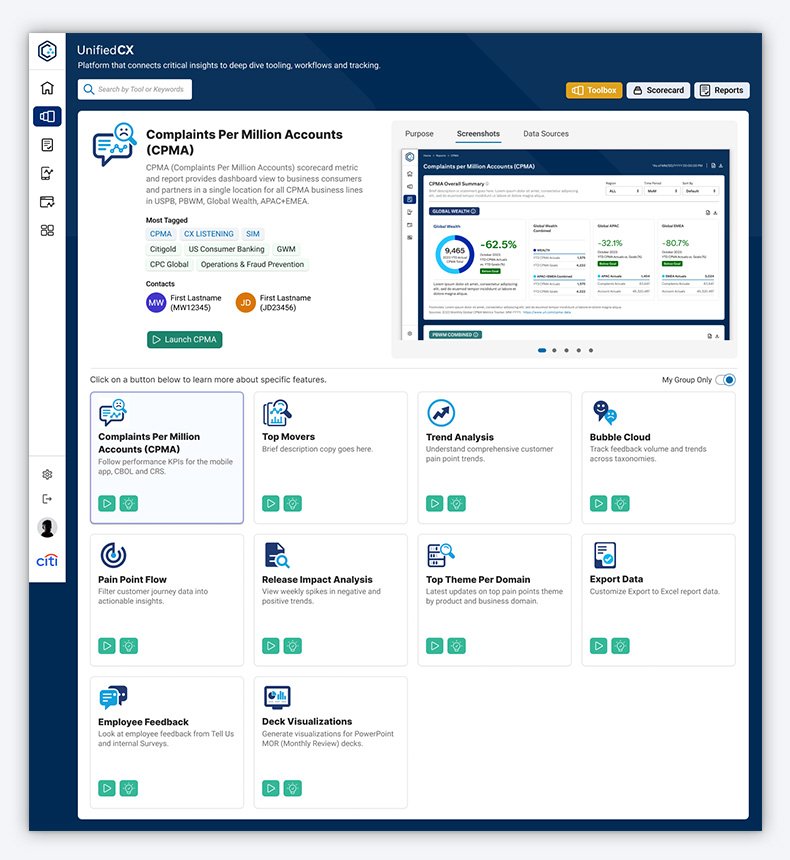
UnifiedCX Toolbox and Guided Experience
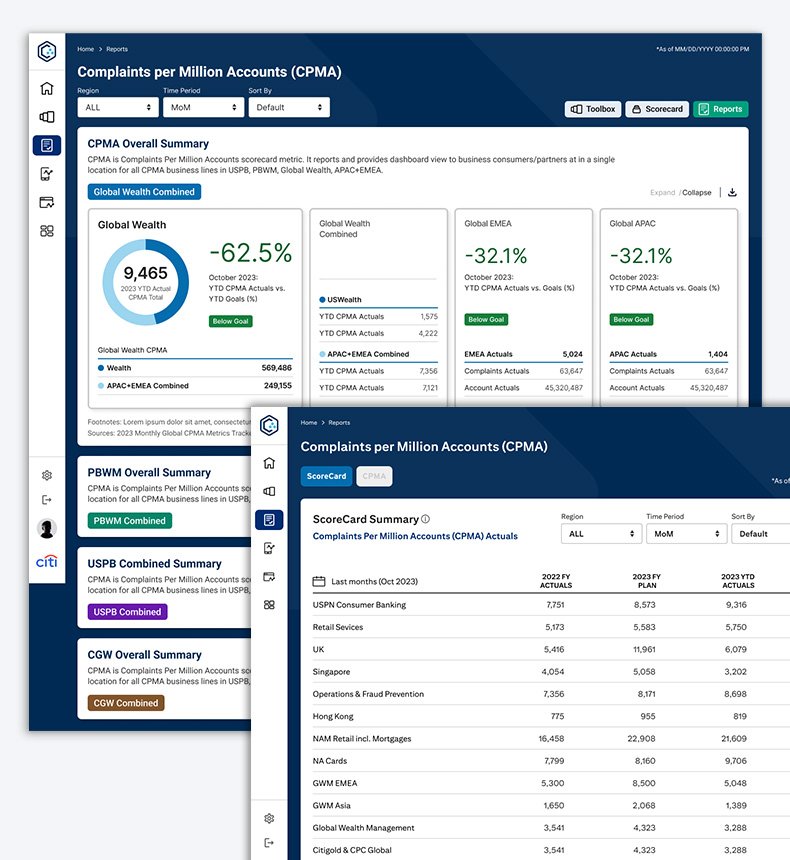
CPMA Report: Complaints Per Million Accounts
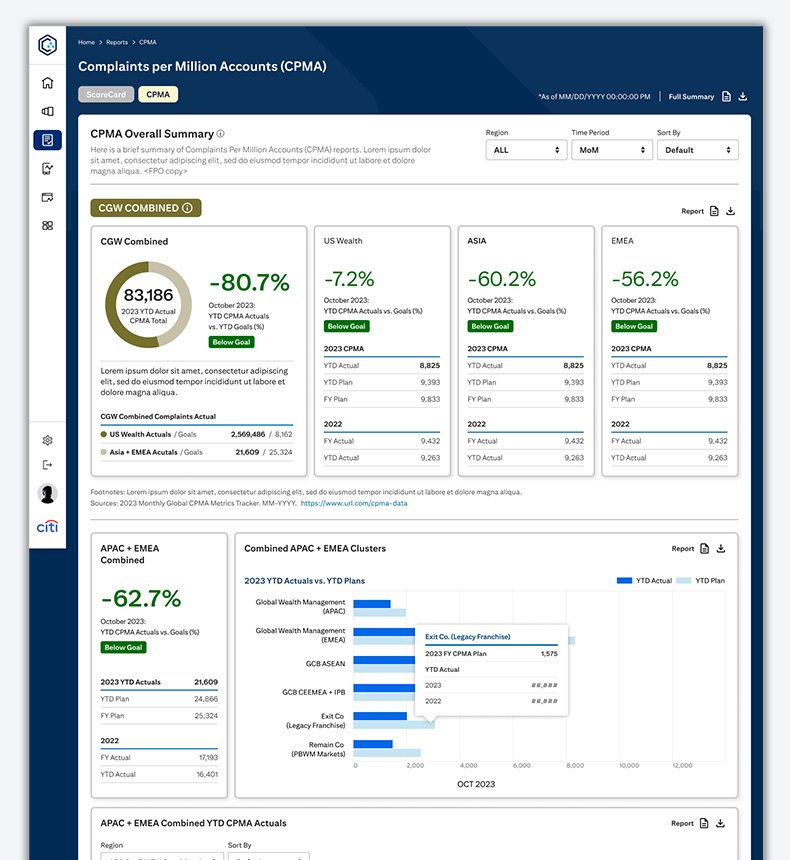
CPMA Objectives The CPMA dashboard delivers operational insights, highlighting negative comments and pain points. Designed to dive deeply into negative data, it analyzes impact, regional operations, and key attributes, comparing actuals against goals. Preset filters and comparison views provide full control over data visualization, empowering informed business strategies.
CPMA Report The CPMA dashboard, which tracks Complaints per Million Accounts, presents negative data in a clear, digestible format for management. Designed under my leadership, it offers a streamlined summary and reporting structure, incorporating performance and operational metrics, AI-driven automation, and more. Beyond status updates, CPMA highlights attributes across sectors, product domains, and regional business health, enabling comprehensive insights for strategic decision-making.
CPMA Summary The CPMA Summary integrates group and individual high-level data, enabling seamless switching and comparison. The Quick Summary View highlights key factors, while the Complex View offers a deep dive with detailed breakdowns. Users can easily update and edit assigned items, action comments, and upload notes, which are linked to JIRA and assigned groups for further processing.
CPMA ScoreCard The CPMA ScoreCard highlights current concerns, trending topics, and critical issues in a digestible, customizable format. It allows users to select specific areas of concern, special operations, or regional reports. Unlike the summary, the ScoreCard offers comparative data across current and past fiscal years, filters out noise, and displays raw data for selected areas.
UnifiedCX TopMovers
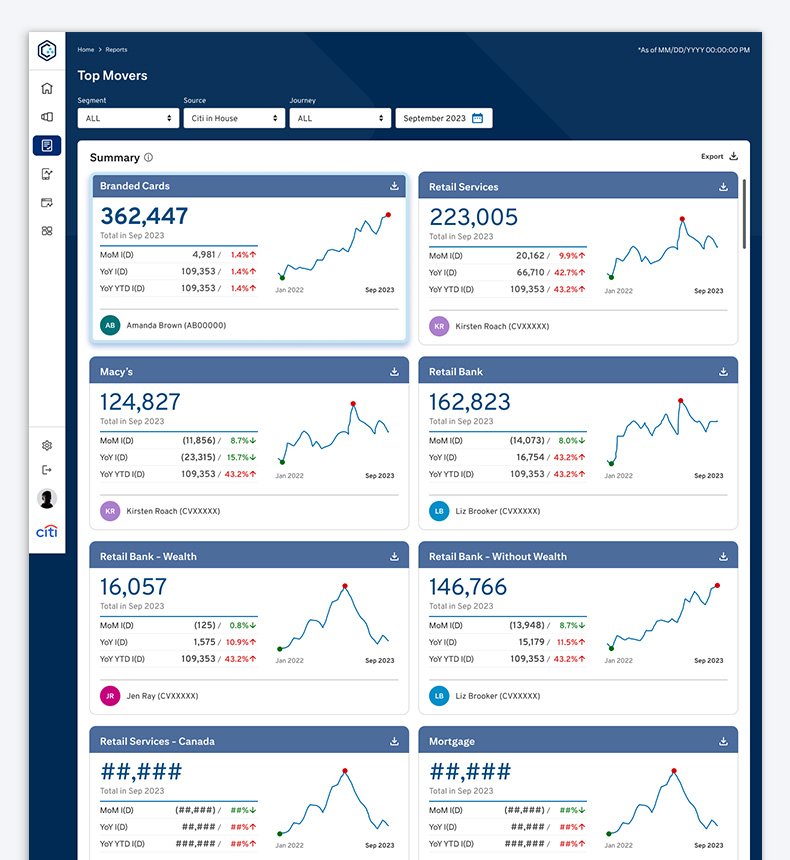
Comprehensive Metrics and Trend Analysis delivers key metrics and updates on critical issues, product domains, and sectors, serving as an all-in-one management tool. It summarizes trending topics, regions, and business areas, allowing data selection by time range, report owner, and actionable items. The platform analyzes data across Line of Business (LOB) impact levels, tracking trends and comparisons. Users can edit action items, and automated reporting streamlines data collection, boosting efficiency and strategic decision-making.
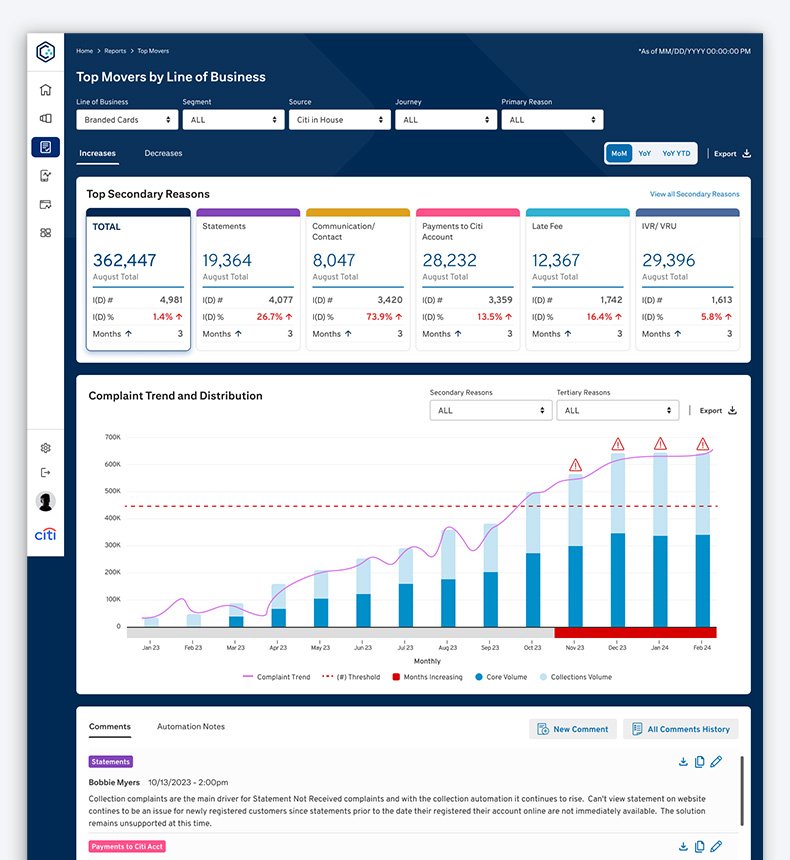
TopMovers Deep-Dive Analysis employs a structured process to uncover problem issues, analyzing secondary factors to identify complaint drivers and trends. It explores tertiary reasons for deeper investigation, revealing underlying causes. This approach delivers comprehensive insights, guiding targeted resolutions
TopMovers Summary integrates diverse data sources to highlight secondary reasons as key factors in reports, displaying complaint and distribution trends. It enables viewing updates, comment editing, and shows historic concerns. The platform offers deep dives into tertiary reasons for additional investigative layers.